MENU

By Simon Pole, Unispace Group Chief Product Officer

In 2020, in the thick of COVID-19’s disruption, Unispace’s global teams were already looking beyond the immediate crisis. While many raced to design the “post‑pandemic office,” complete with distancing decals and sneeze screens (see: Cushman & Wakefield’s Six Feet Office), our approach was different.

We chose foresight over fear.

6FO-1672x1254

Image 1 - Cushman & Wakefield; Six Feet Office. 2020

Rather than reacting to the short-term, the Unispace Strategy Team—led by Albert DePlazaola—began to look forward. Our clients, like much of the real estate and business world, were asking: What happens next? “There was no first‑mover advantage,” DePlazaola reflected. “The entire industry was in a holding pattern.”

To break the deadlock between landlords and occupiers, our team built something practical, data-driven, and regionally specific: the Remote Work Profiler.

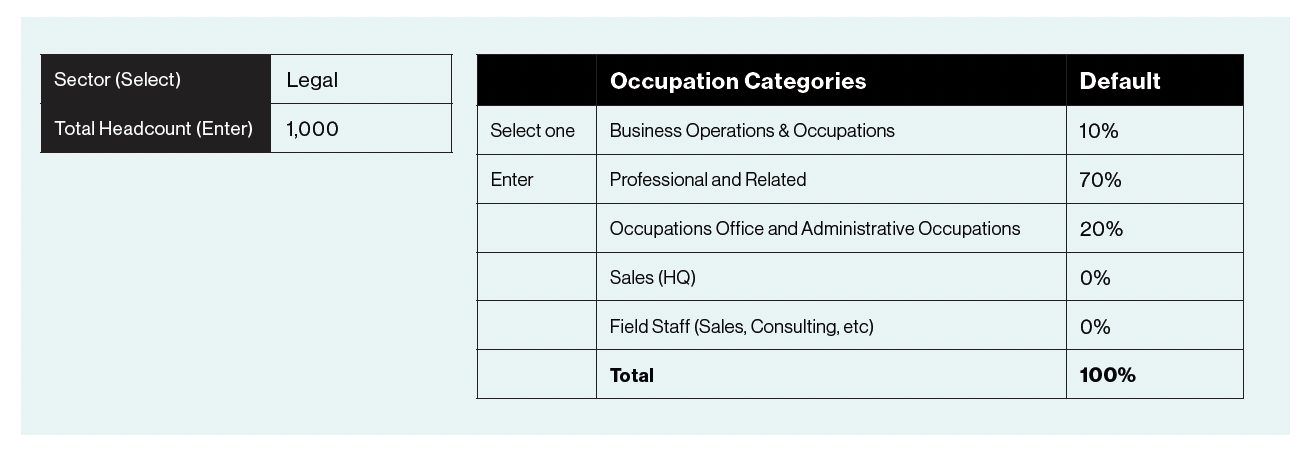
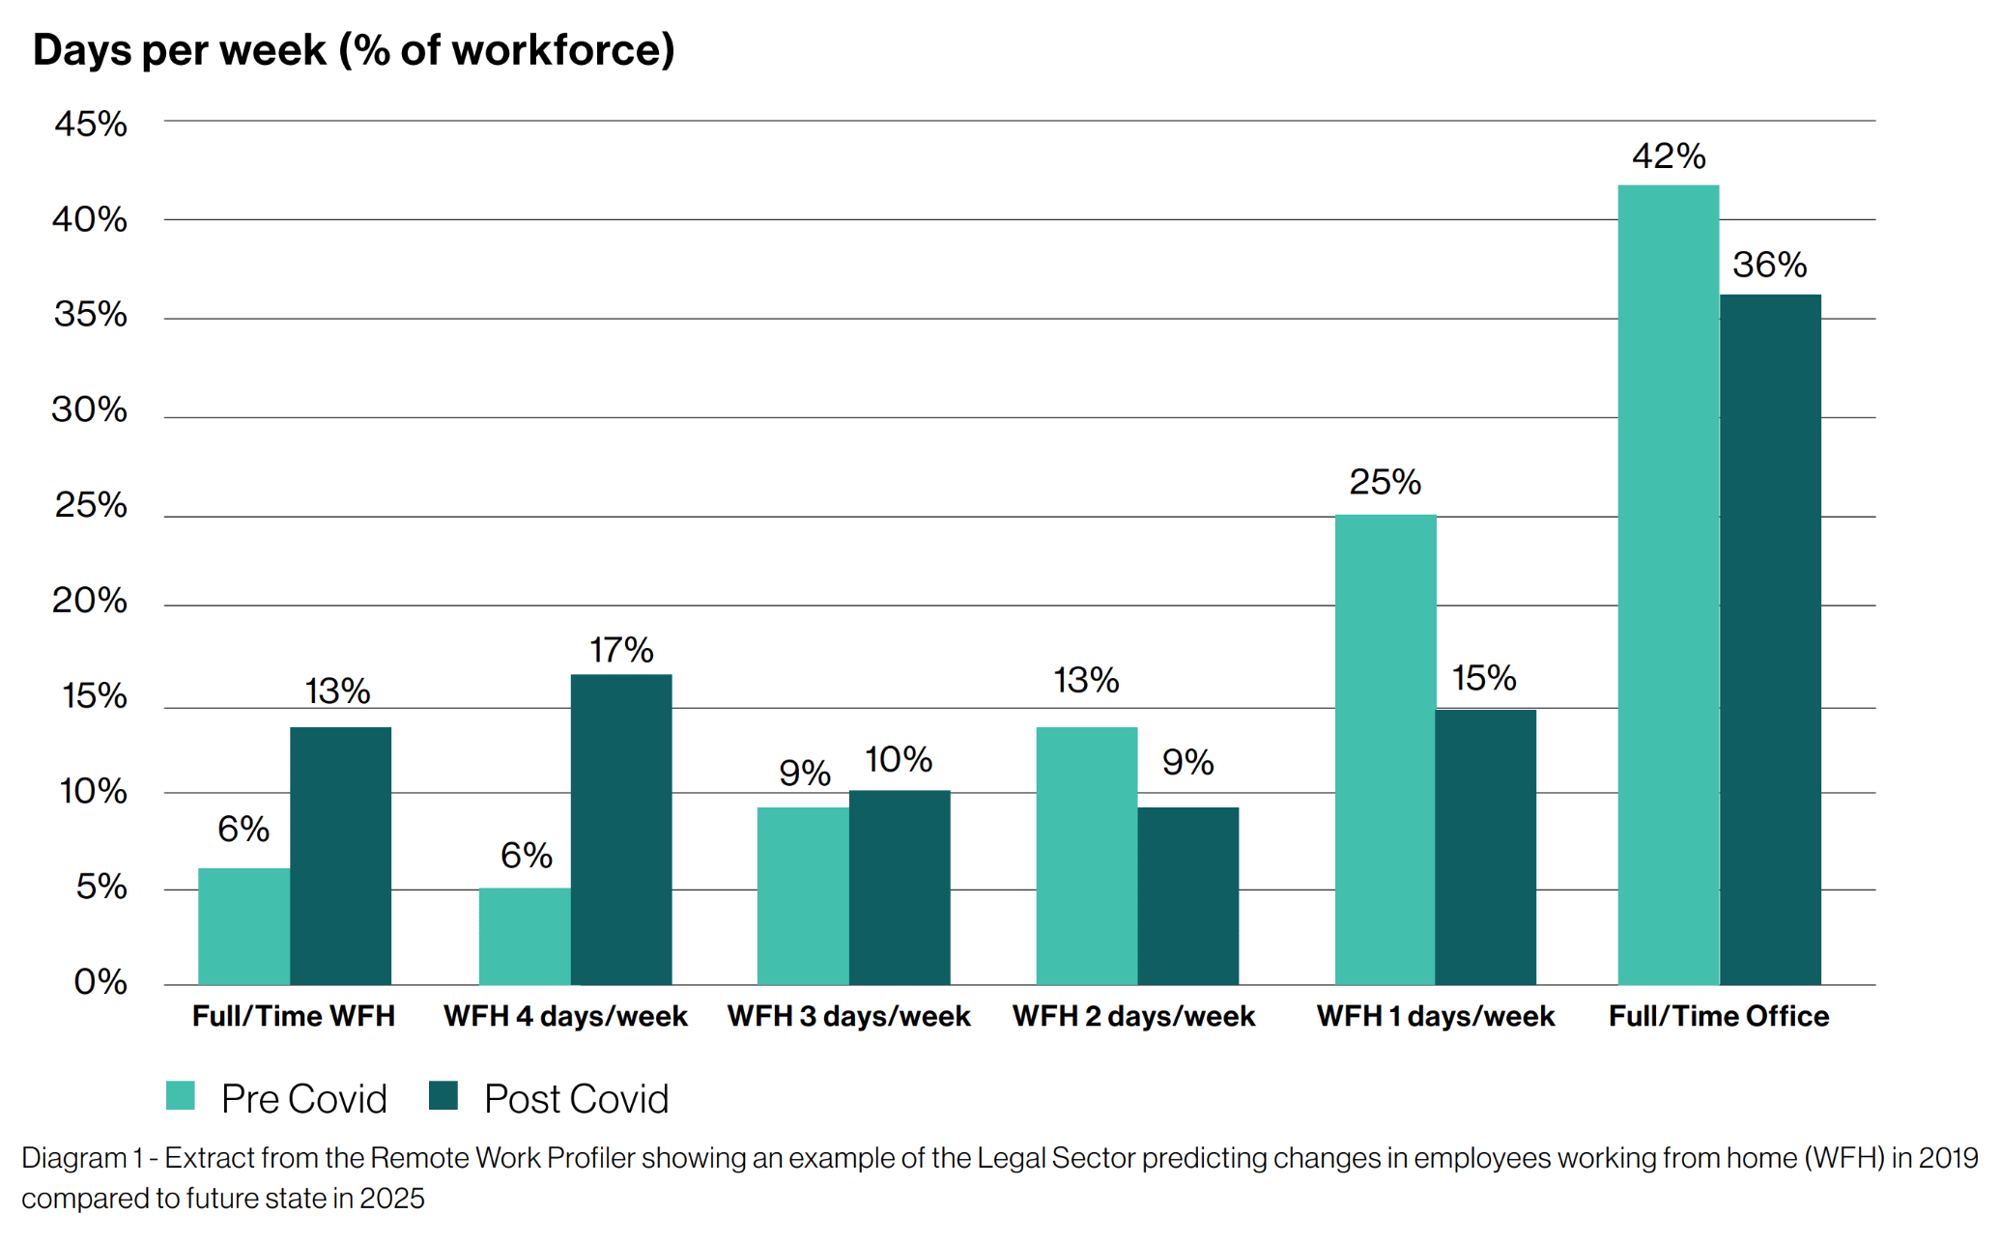
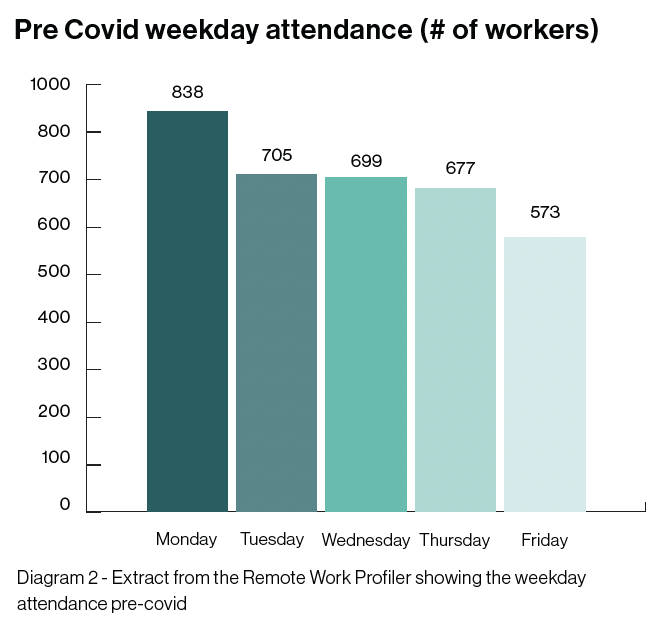
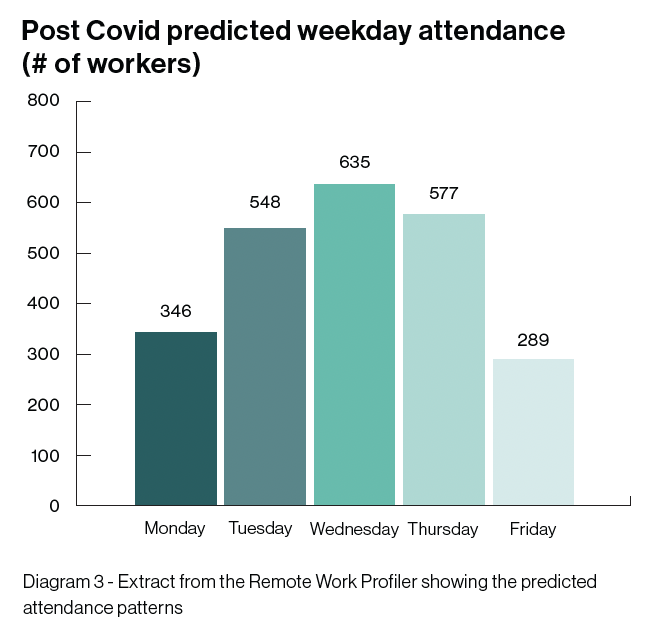
This predictive analytics tool pulled from major sources like the Bureau of Labor Statistics, Bureau of Economic Analysis, and Eurostat to analyse office attendance by job category and day of the week—across different geographies and industries.

The profiler didn’t just speculate about the future of work-from‑home (WFH). It quantified it—forecasting daily peaks and troughs in office attendance, broken down by role, region, and sector.

From there, real estate teams, facility managers, and operations leaders could calculate the right number of desks, design the right amount of collaboration space, and manage occupancy with precision.

Unispace’s Group Chief Product Officer and legal office specialist Simon Pole remarked,

“The breakdown via employee category was really helpful when we translated the outputs into space plans as we know the business operations team works differently from lawyers or the business development team… so we could be more specific in the space allocations”.

Remote work profiler Australia

The Remote Work Profiler tool (Diagram 1) illustrates the predicted profile of employees across the work week when analysing the shift in Working From Home and full-time in the office. This example is based on the Australian legal sector.

In 2020, we modelled a firm with 1,000 employees—70% fee earners and 30% support and leadership. Our profiler forecast a shift: full-time office attendance would drop from 42% to 36%, while fully remote roles would grow from 6% to 13%. Crucially, it also predicted that Wednesday—not Monday—would become the new peak day in the office.

At the time, this was considered a bold claim. But five years later, the current global data tells the story.

Screenshot 2025-08-20 at 14.02.29
Screenshot 2025-08-21 at 09.30.25

The office utilisation shift: Prediction vs. reality

Major changes

The most interesting insight was how the office would be utilised throughout the week.

Prior to covid, the legal office profile showed that average attendance across the week would be 698 employees (~70% in this example) with the peak attendance being 838 employees in the office on a Monday, diminishing to the lowest attendance of 573 employees on a Friday.

While for many businesses this may seem high, however our data shows that legal firms are typically the highest users of real estate when compared to all industries due to the long hours at the desk and cultural expectations of presenteeism for continual knowledge-sharing.

The Remote Work Profiler tool (Diagram 3) illustrates the predicted profile of employees across the work week with the peak predicted on a Wednesday, and Monday dropping off significantly. While this was challenged at the time when we started showing occupiers this data (2020), this is certainly where the data is indicating in 2025. This profile is commonly referred to TWATs (Tuesday, Wednesday and Thursdays) and has been the preference of most hybrid employees post covid.

Screenshot 2025-08-20 at 14.13.33
Screenshot 2025-08-20 at 14.13.47

Power shift: From employees to employers

As a global business, Unispace is very interested in office utilisation and how to deliver appropriate space solutions to meet the needs of our clients. Over the past six months, we’ve observed a noticeable shift in workplace policy enforcement from our clients.

As economic uncertainty softens the talent war, more employers are reasserting expectations around in-office attendance. The market is tilting back toward employer‑led norms, and with it, utilisation is inching upward again.

At Unispace, we’ve been investing in workplace strategy and data for over a decade. And while no tool is infallible, we’re proud of how accurately the Remote Work Profiler anticipated the longer-term patterns of behaviour we’re seeing today.

The fate of the office is still unfolding—but one thing is clear: reliable, region-specific insights are essential for real estate decisions that work today and tomorrow.

Current data

The latest data (Diagram 4) taken from the commercial office sensor platform XY Sense (Q1 2025) validates our forecast of the TWAT profile. While their data spans all industries—not just legal—Tuesday is now confirmed as the highest occupancy day, with Wednesday and Thursday close behind.

Perhaps more importantly, this shows rising office attendance in Q1 2025—up roughly 10% on Tuesdays alone compared to Q1 2024. While some of this may be seasonal, a clear trend is emerging: employers are becoming more assertive with office

Interestingly, utilisation by country (see Diagram 5) suggests that England is a clear leader of the countries analysed, with some seasonal influences noted in office attendance per quarter. Unispace observed that return-to-office policies were enforced across the UK earlier than in many countries, and this may have an influence on this statistic.  We also note that our teams in India and South East Asia have had stable numbers return to the office, mainly due to a high percentage of apartments, cultural expectations, multi-generational living arrangements, and accommodation sizes, thereby making the office the most suitable place to conduct work. For the remaining countries on this list, we will wait and see if this moves over the next 12 months as the markets change in these regions.

Screenshot 2025-08-20 at 15.27.15
Screenshot 2025-08-20 at 15.27.05